

Some Change For StatsPanda
The newsletter is taking a pivot in 2026, one more aligned with StatsPanda's future

For the past 3+ years, this newsletter has been where we share data stories — the kind that make you stop scrolling and actually think. That’s not changing.
But the newsletter is.
Going forward, this newsletter will be the primary home to all changes going on at StatsPanda: from the website where we’ll showcase new features, product launches, platform updates, partnerships, and the thinking behind all of it.
To our overall brand, the direction, our profitability, vision for the future, partnerships and how we’re trying to impact the world through data.
What you know us from (probably) - The data stories you love will still land in your inbox — they’re just moving to a new home, statspanda.com, where they’ll stay permanently.
Think of it less as a newsletter and more as an insider channel for people who actually care about data which I know you do.
Where StatsPanda.com Stands Today
We’ve been building quietly. Here’s a look at what the platform covers right now.
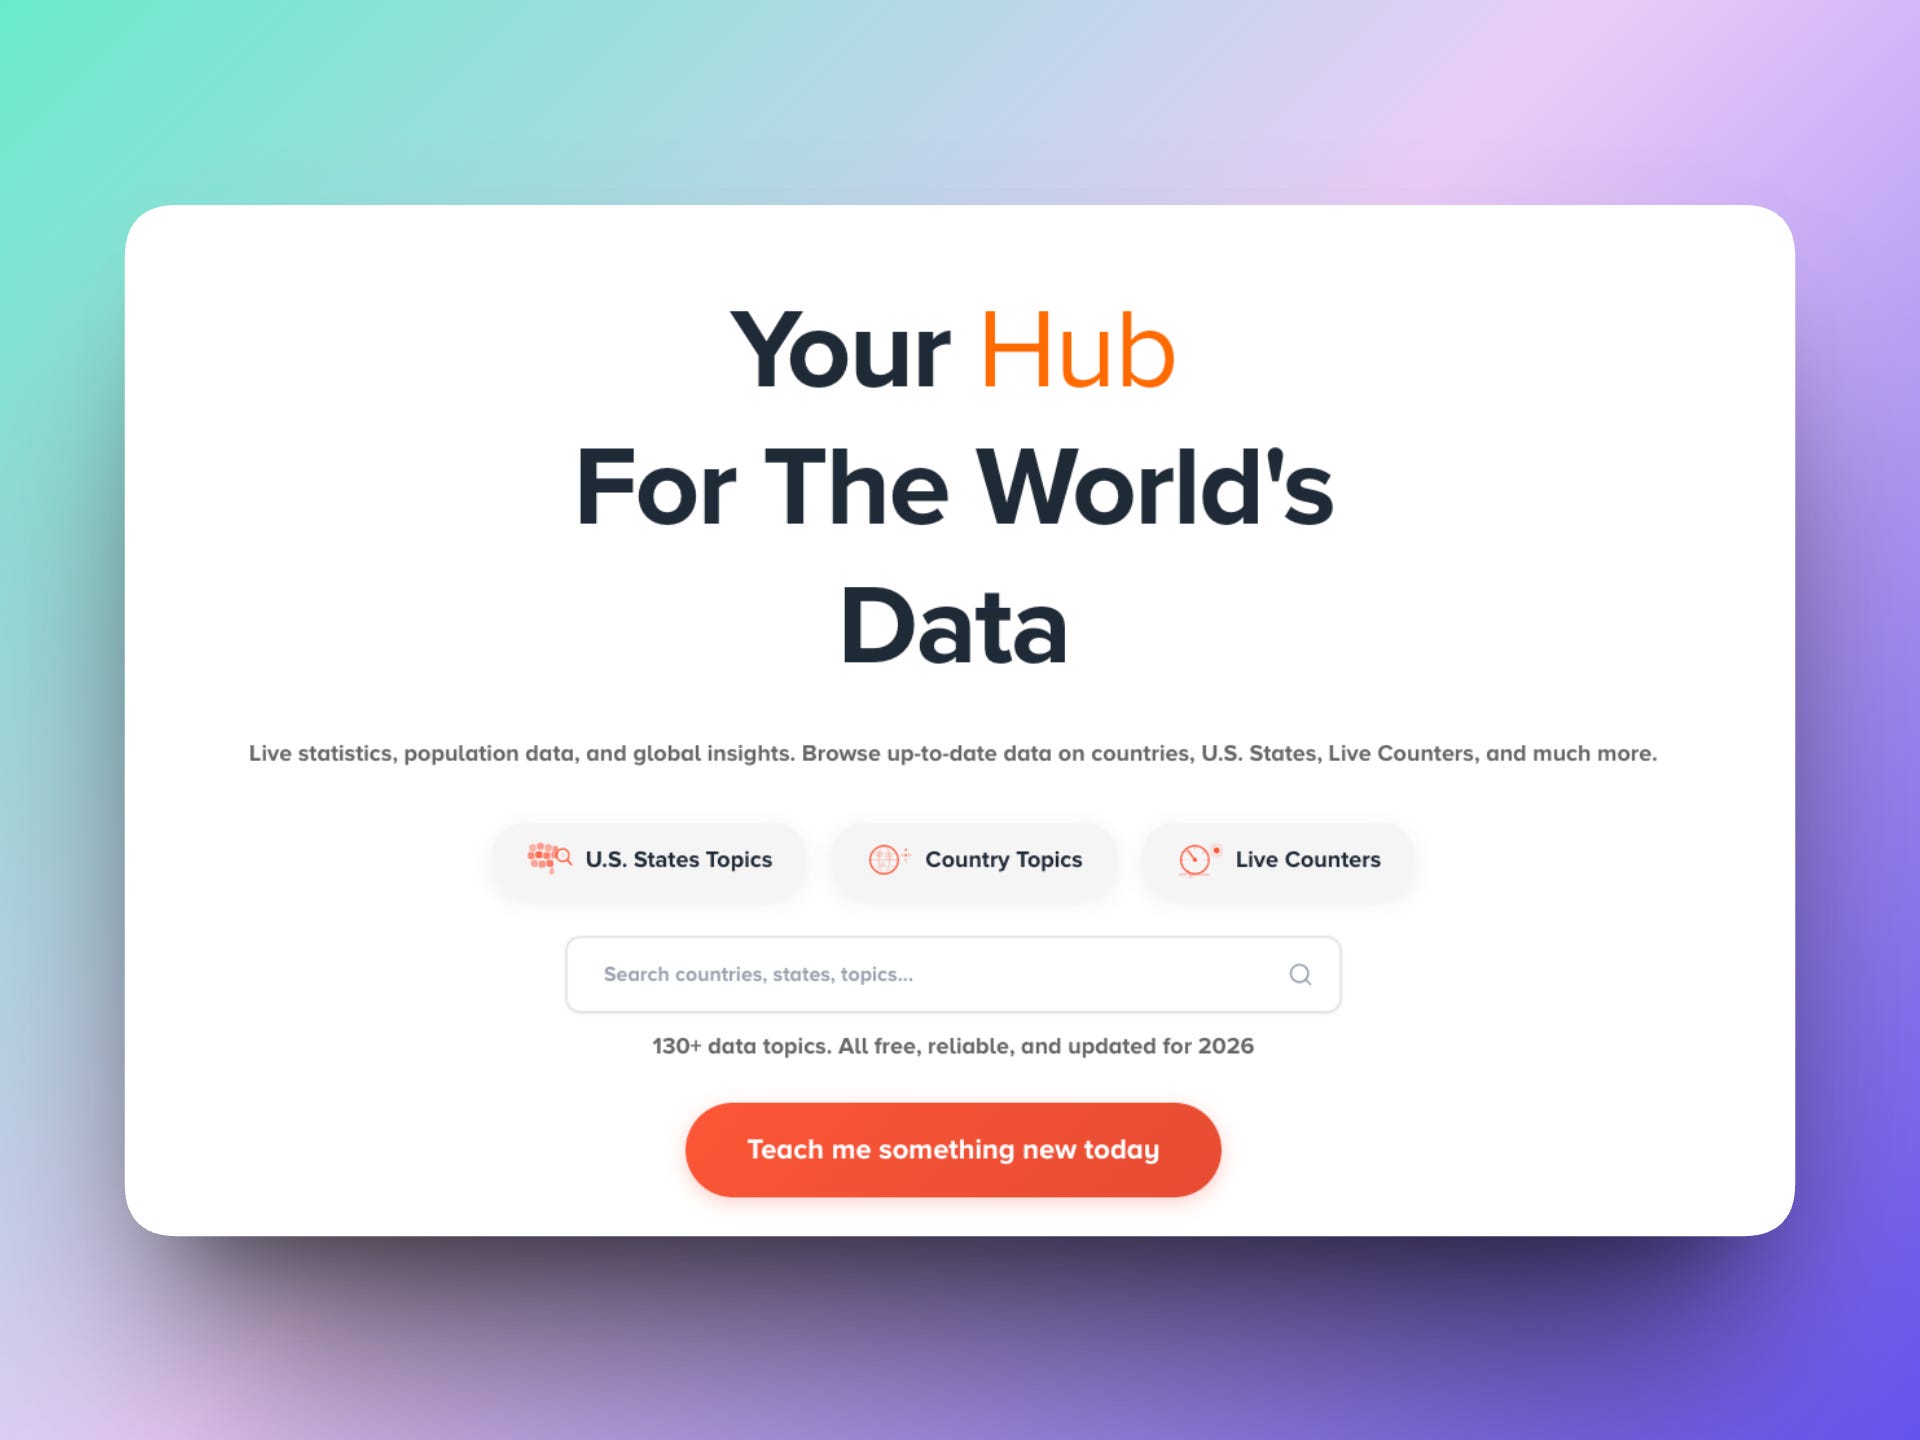
Your Hub for the World’s Data
The homepage puts everything within reach: U.S. State topics, Country topics, Live Counters, and a search bar that pulls from 130+ data topics. All free, reliable, and updated for 2026.
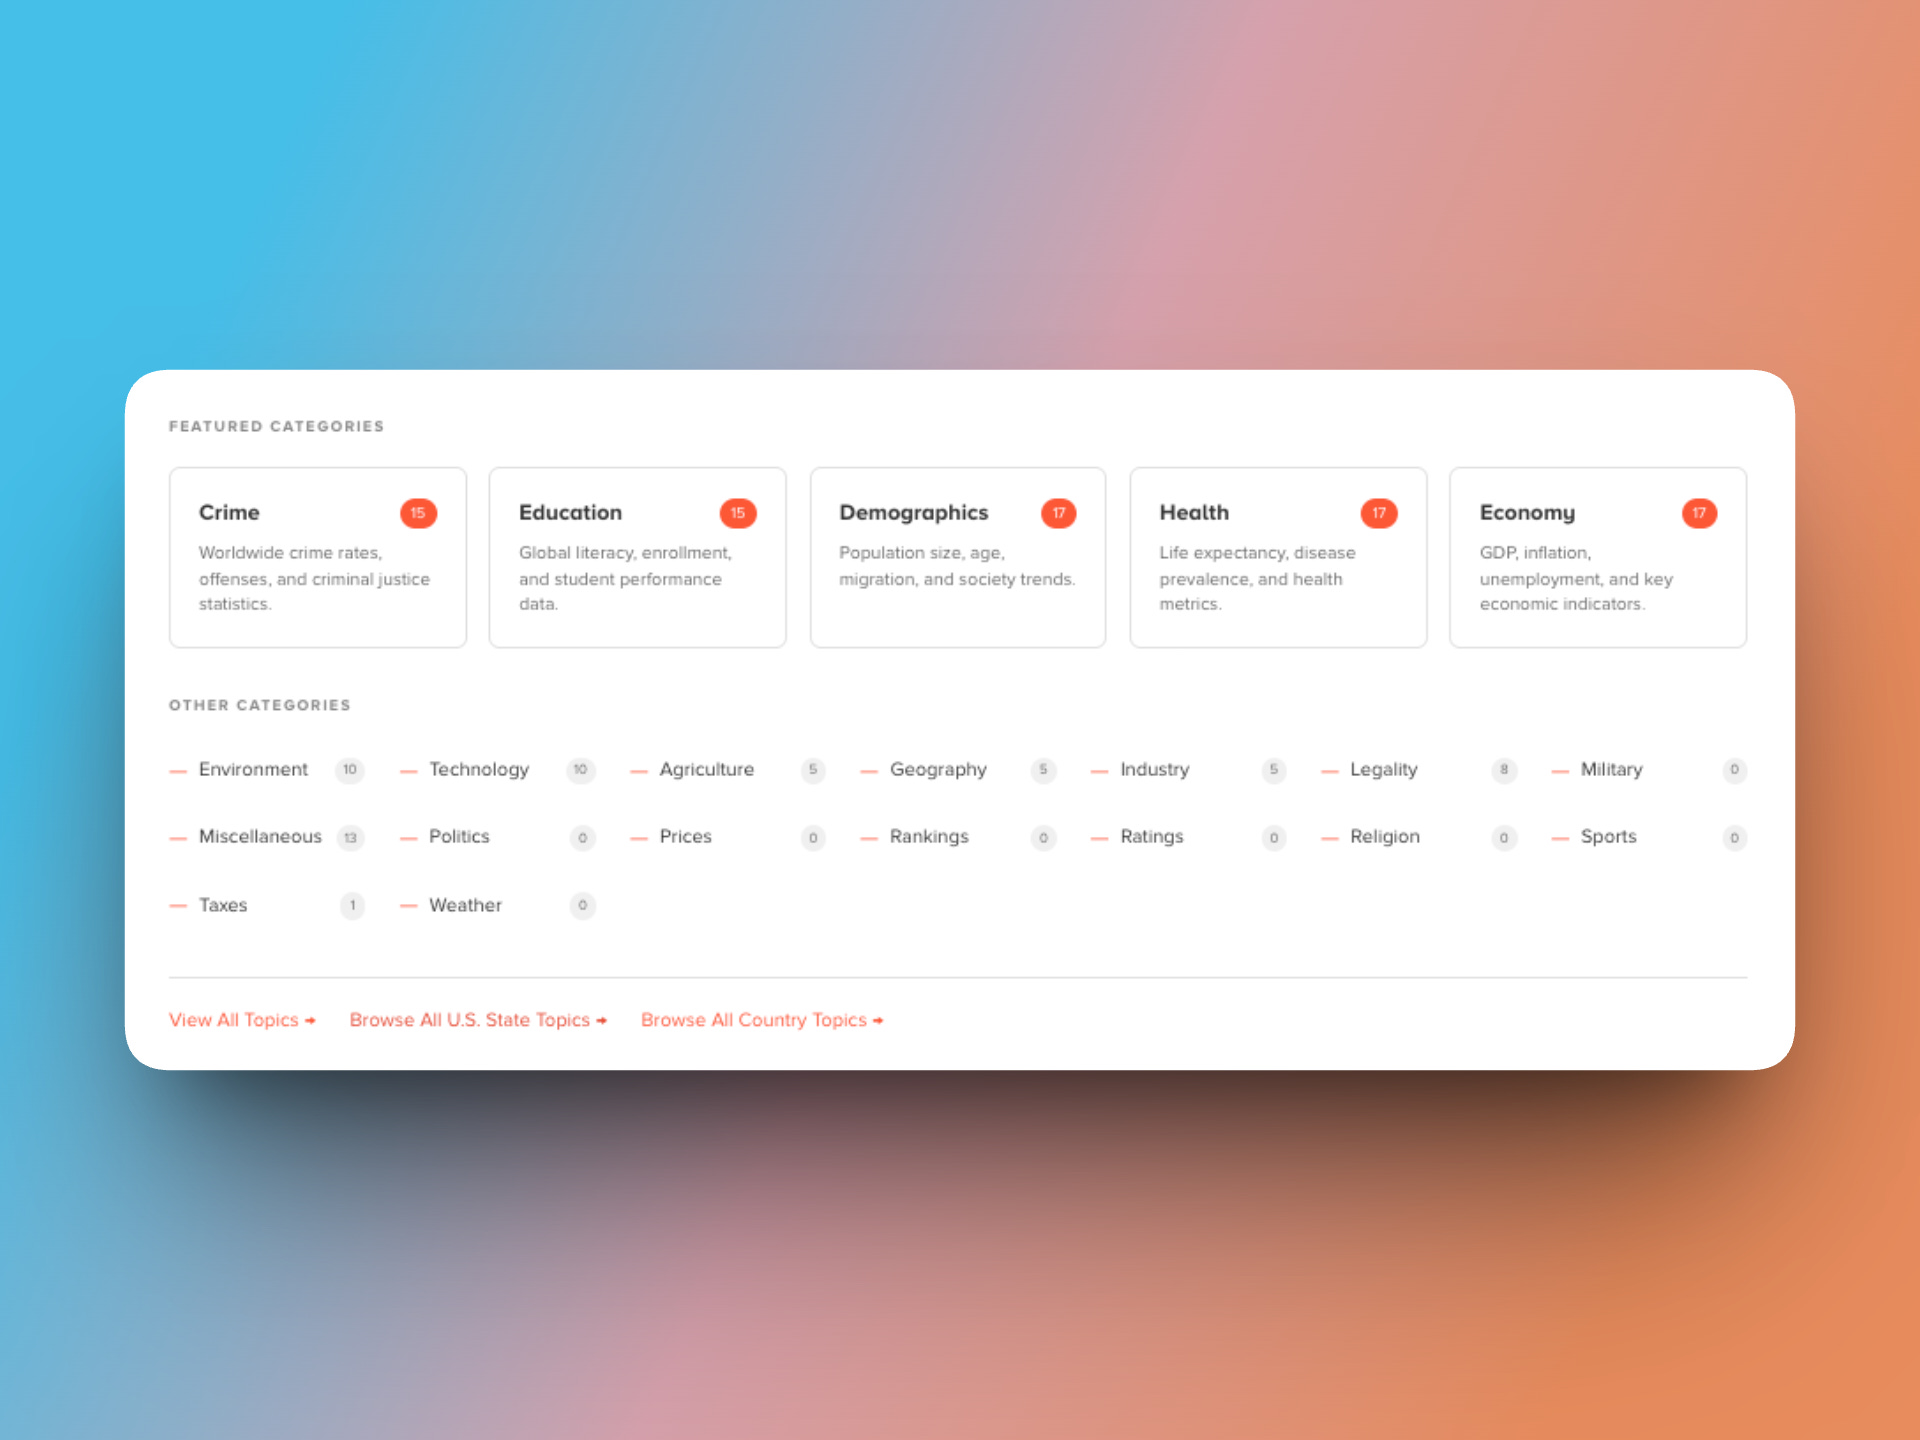
Browse by What Matters to You
From Crime and Education to Health, Economy, and Demographics — every topic is organized into categories with topic counts so you always know what’s available. The “Other Categories” section is filling in fast and we are CONSTANTLY adding new data topics.
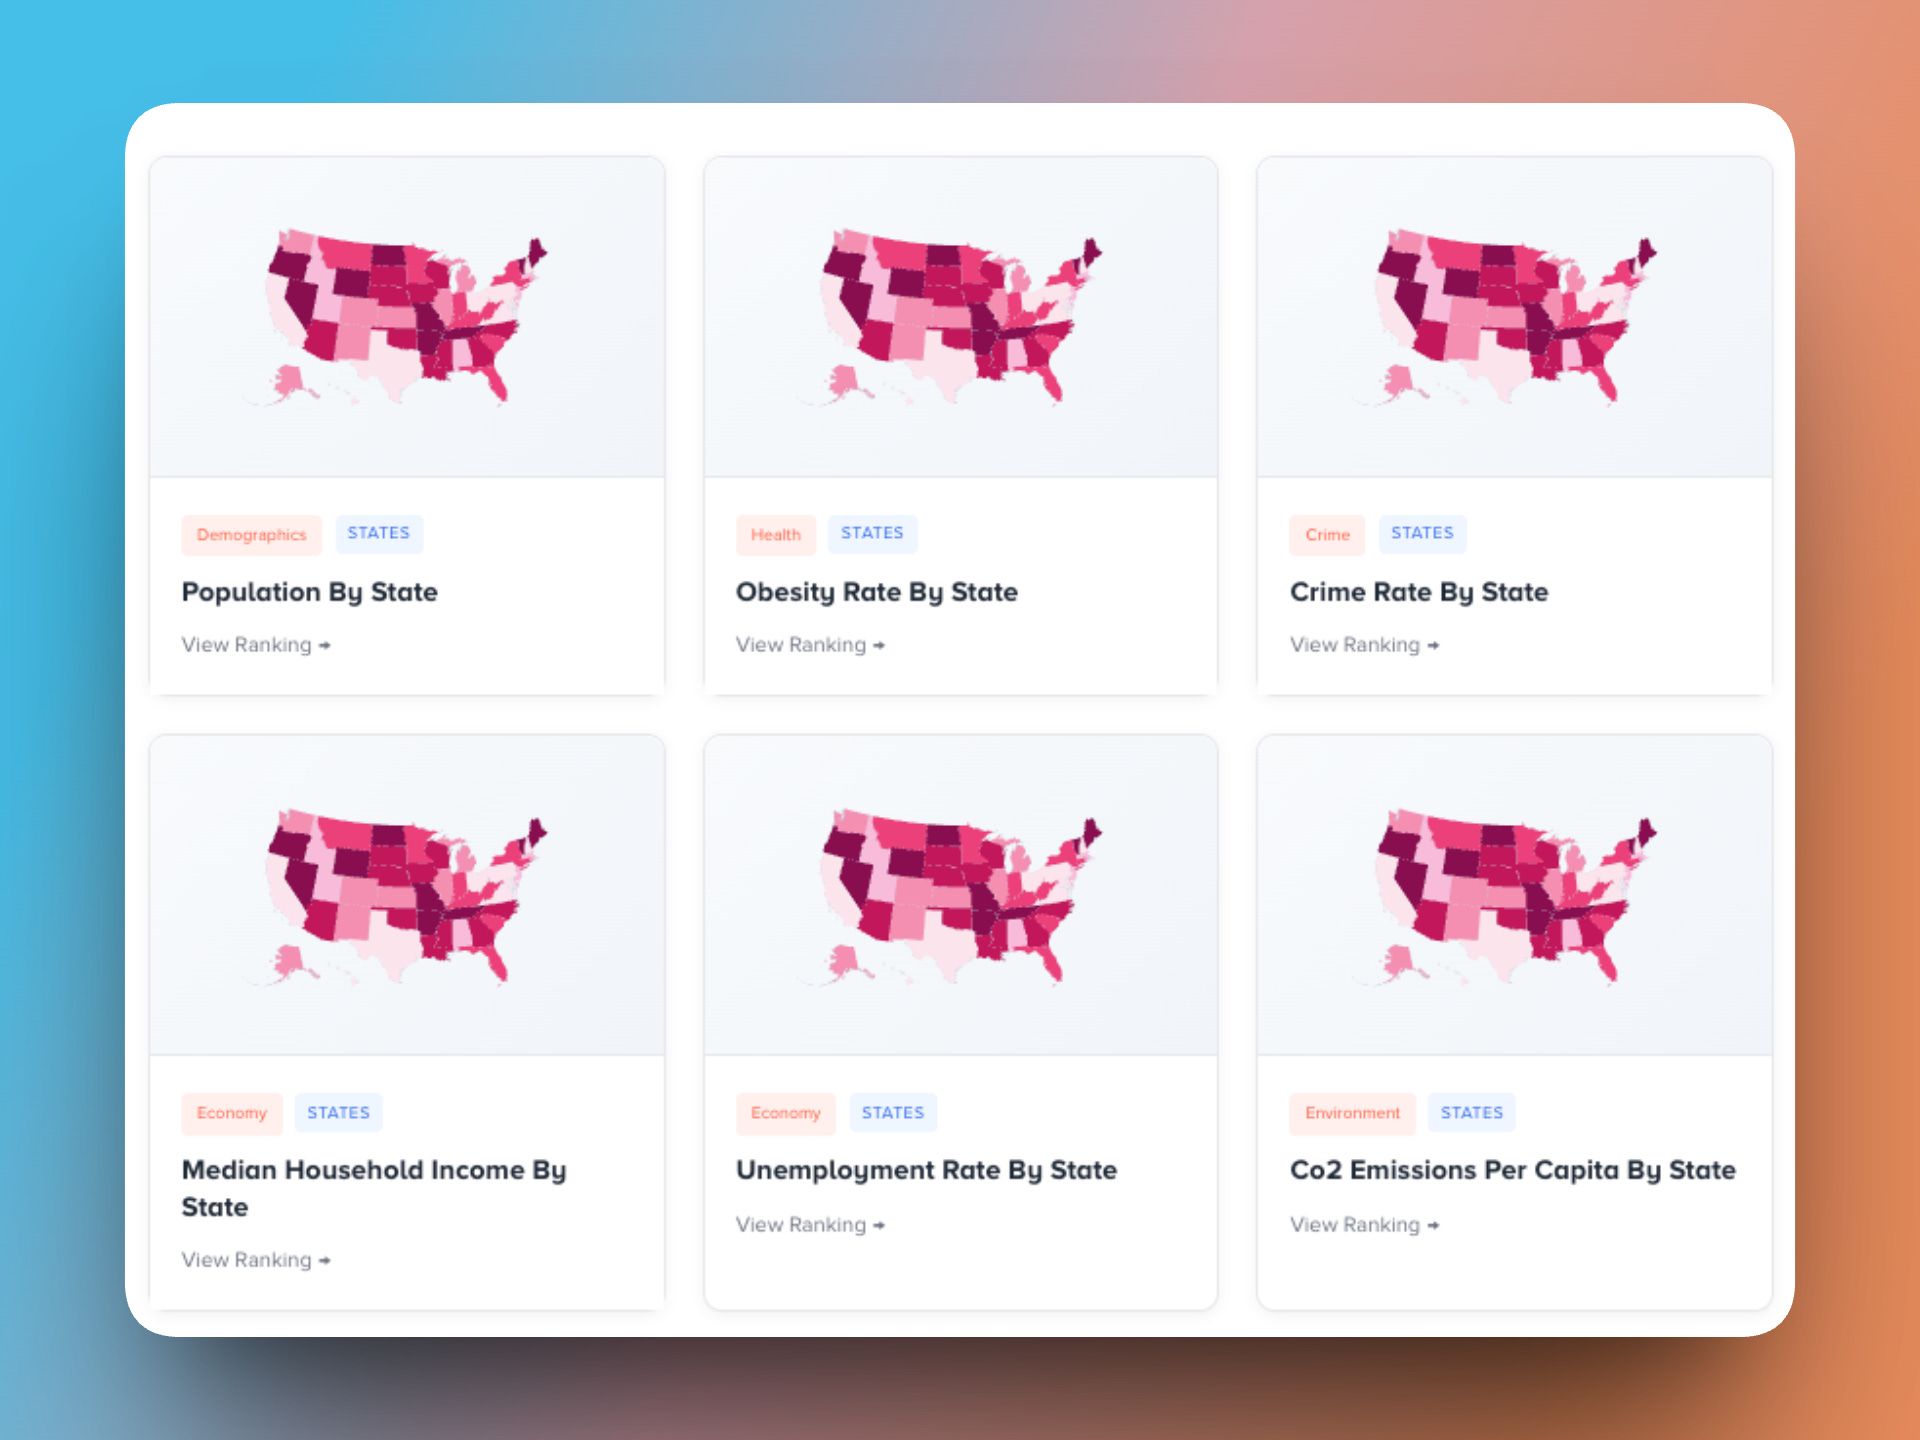
Every U.S. State, Mapped and Ranked
State-level topics aren’t just tables. Each one leads to an interactive map, a full ranking, and data you can actually explore. Population, obesity, income, crime, CO₂ emissions — it’s all there to easily digest…we hope.
Deep-Dive Topic Pages
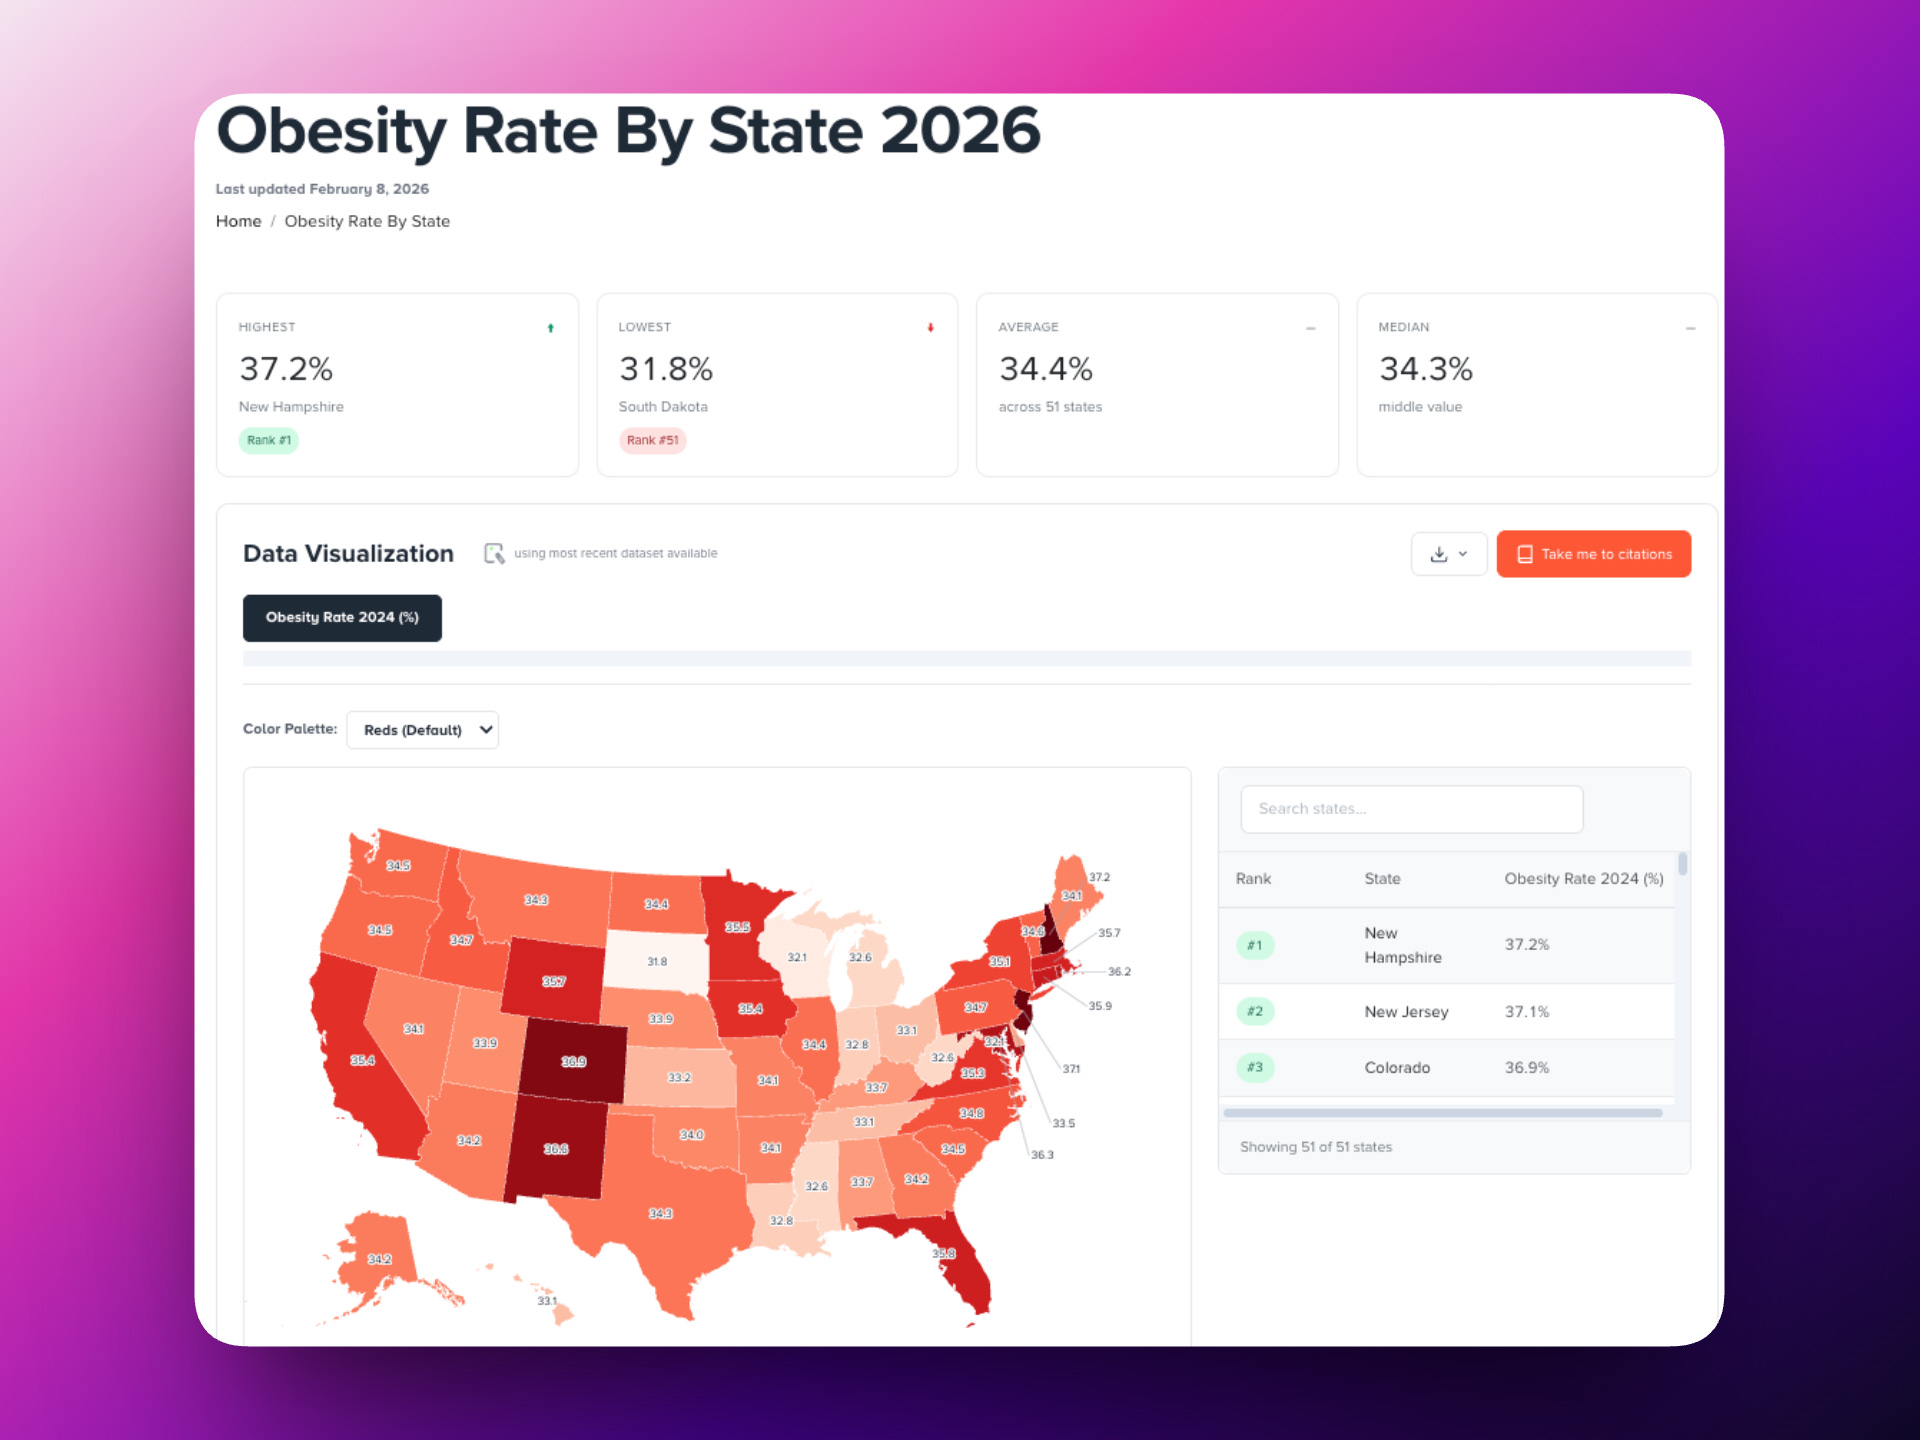
Every topic page opens with the headline numbers you care about: highest, lowest, average, median. Then a full interactive choropleth map.
Then a ranked table you can search and download with a full summary and detailed breakdown after along with individual rankings after that. And of course we have citations for all these data topic pages.
This is what a data page should feel like.
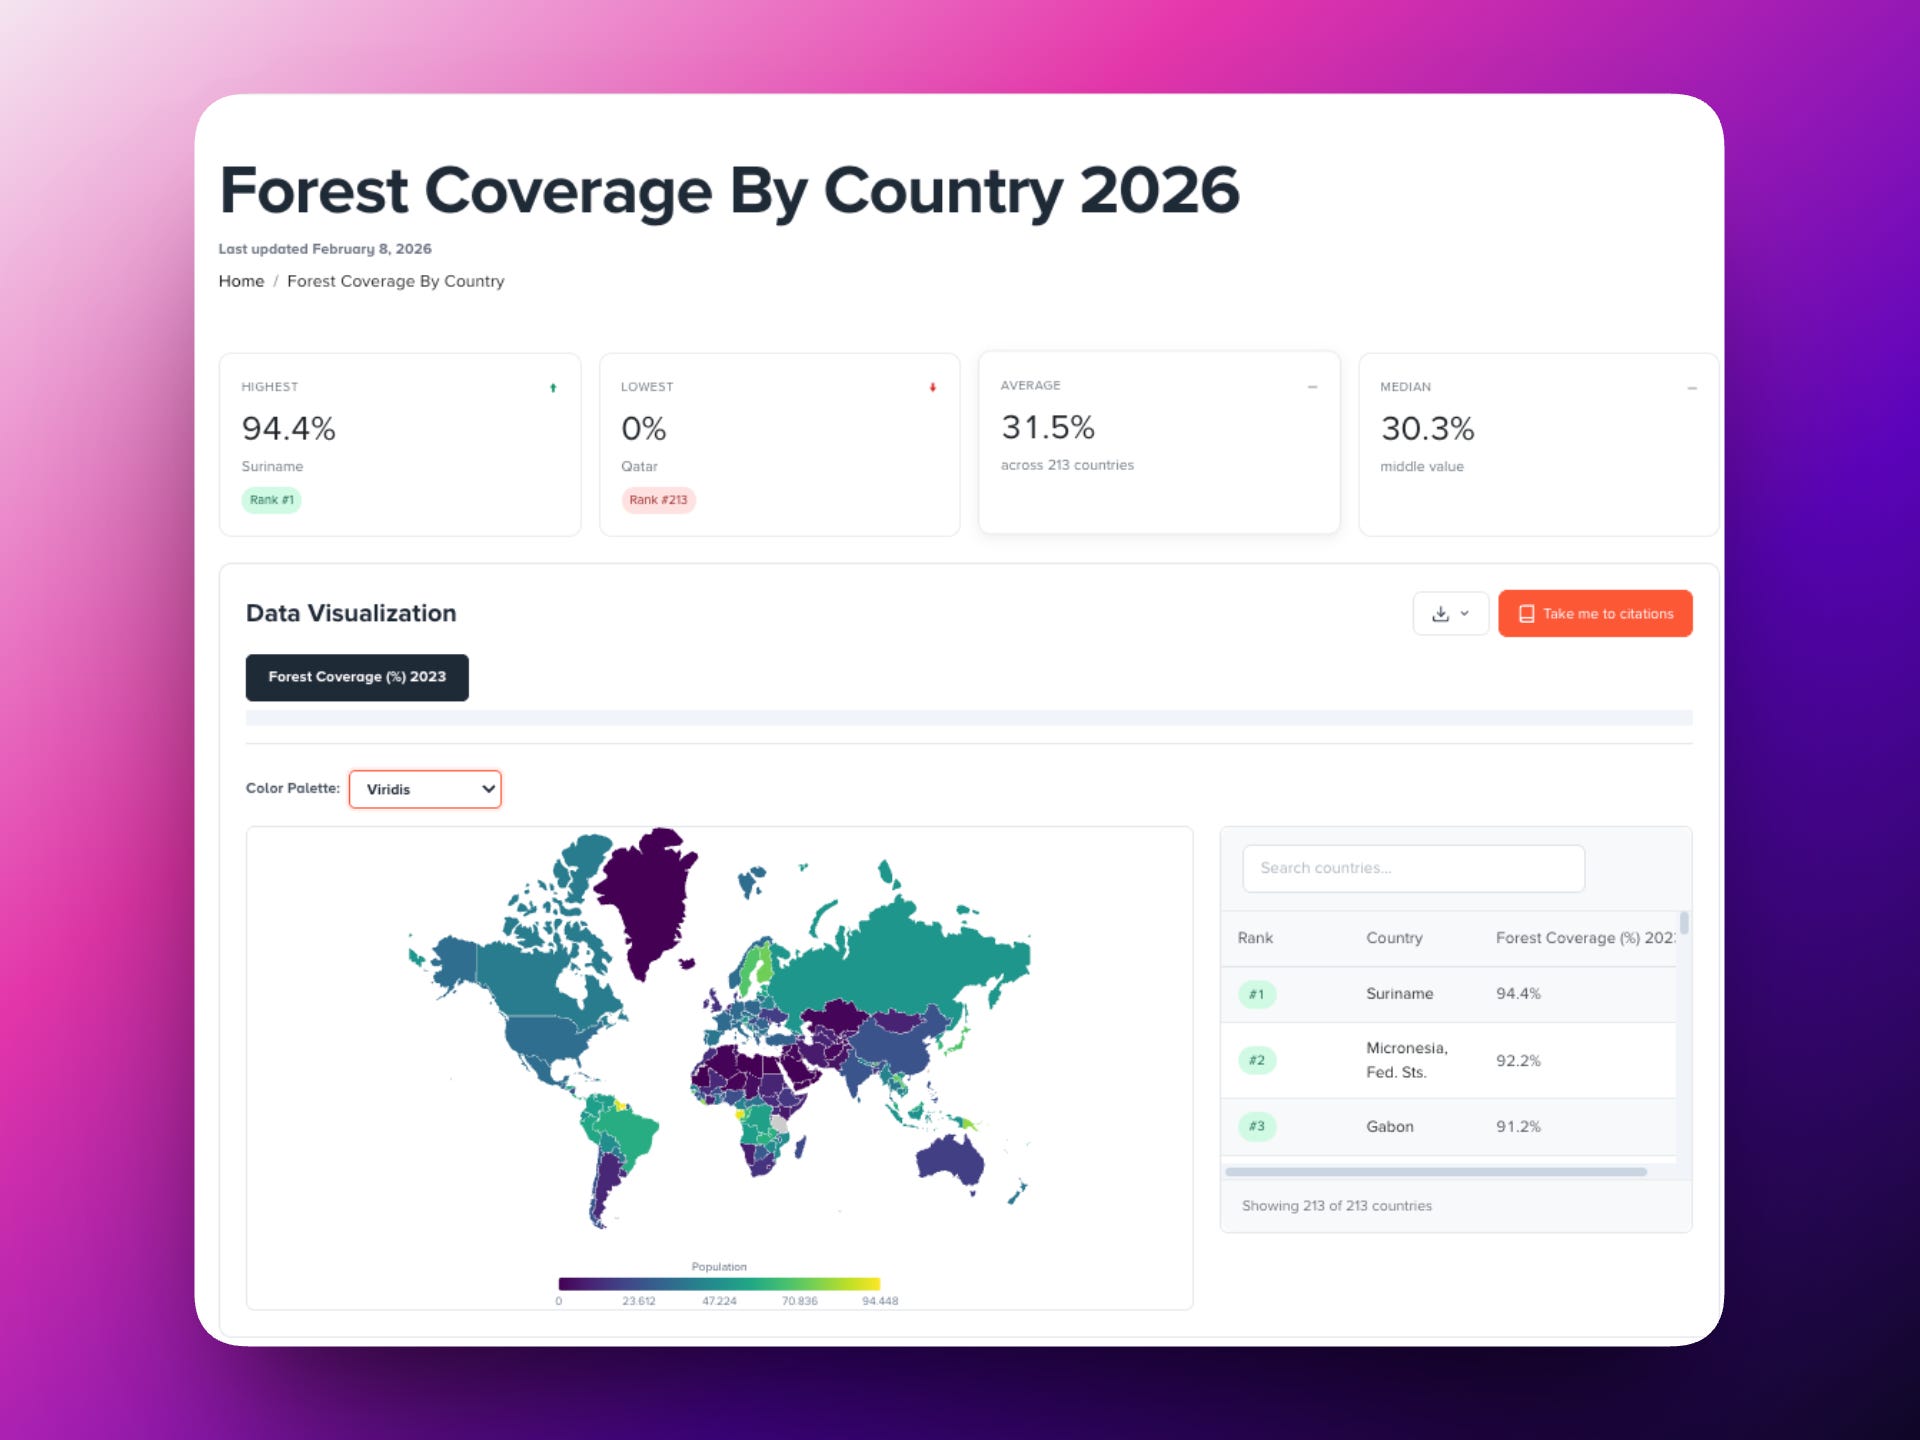
195 Countries. Real Data.
The same experience that powers state pages applies globally. Forest coverage, population, economics, health — with color palette options, source citations, and export tools built in.
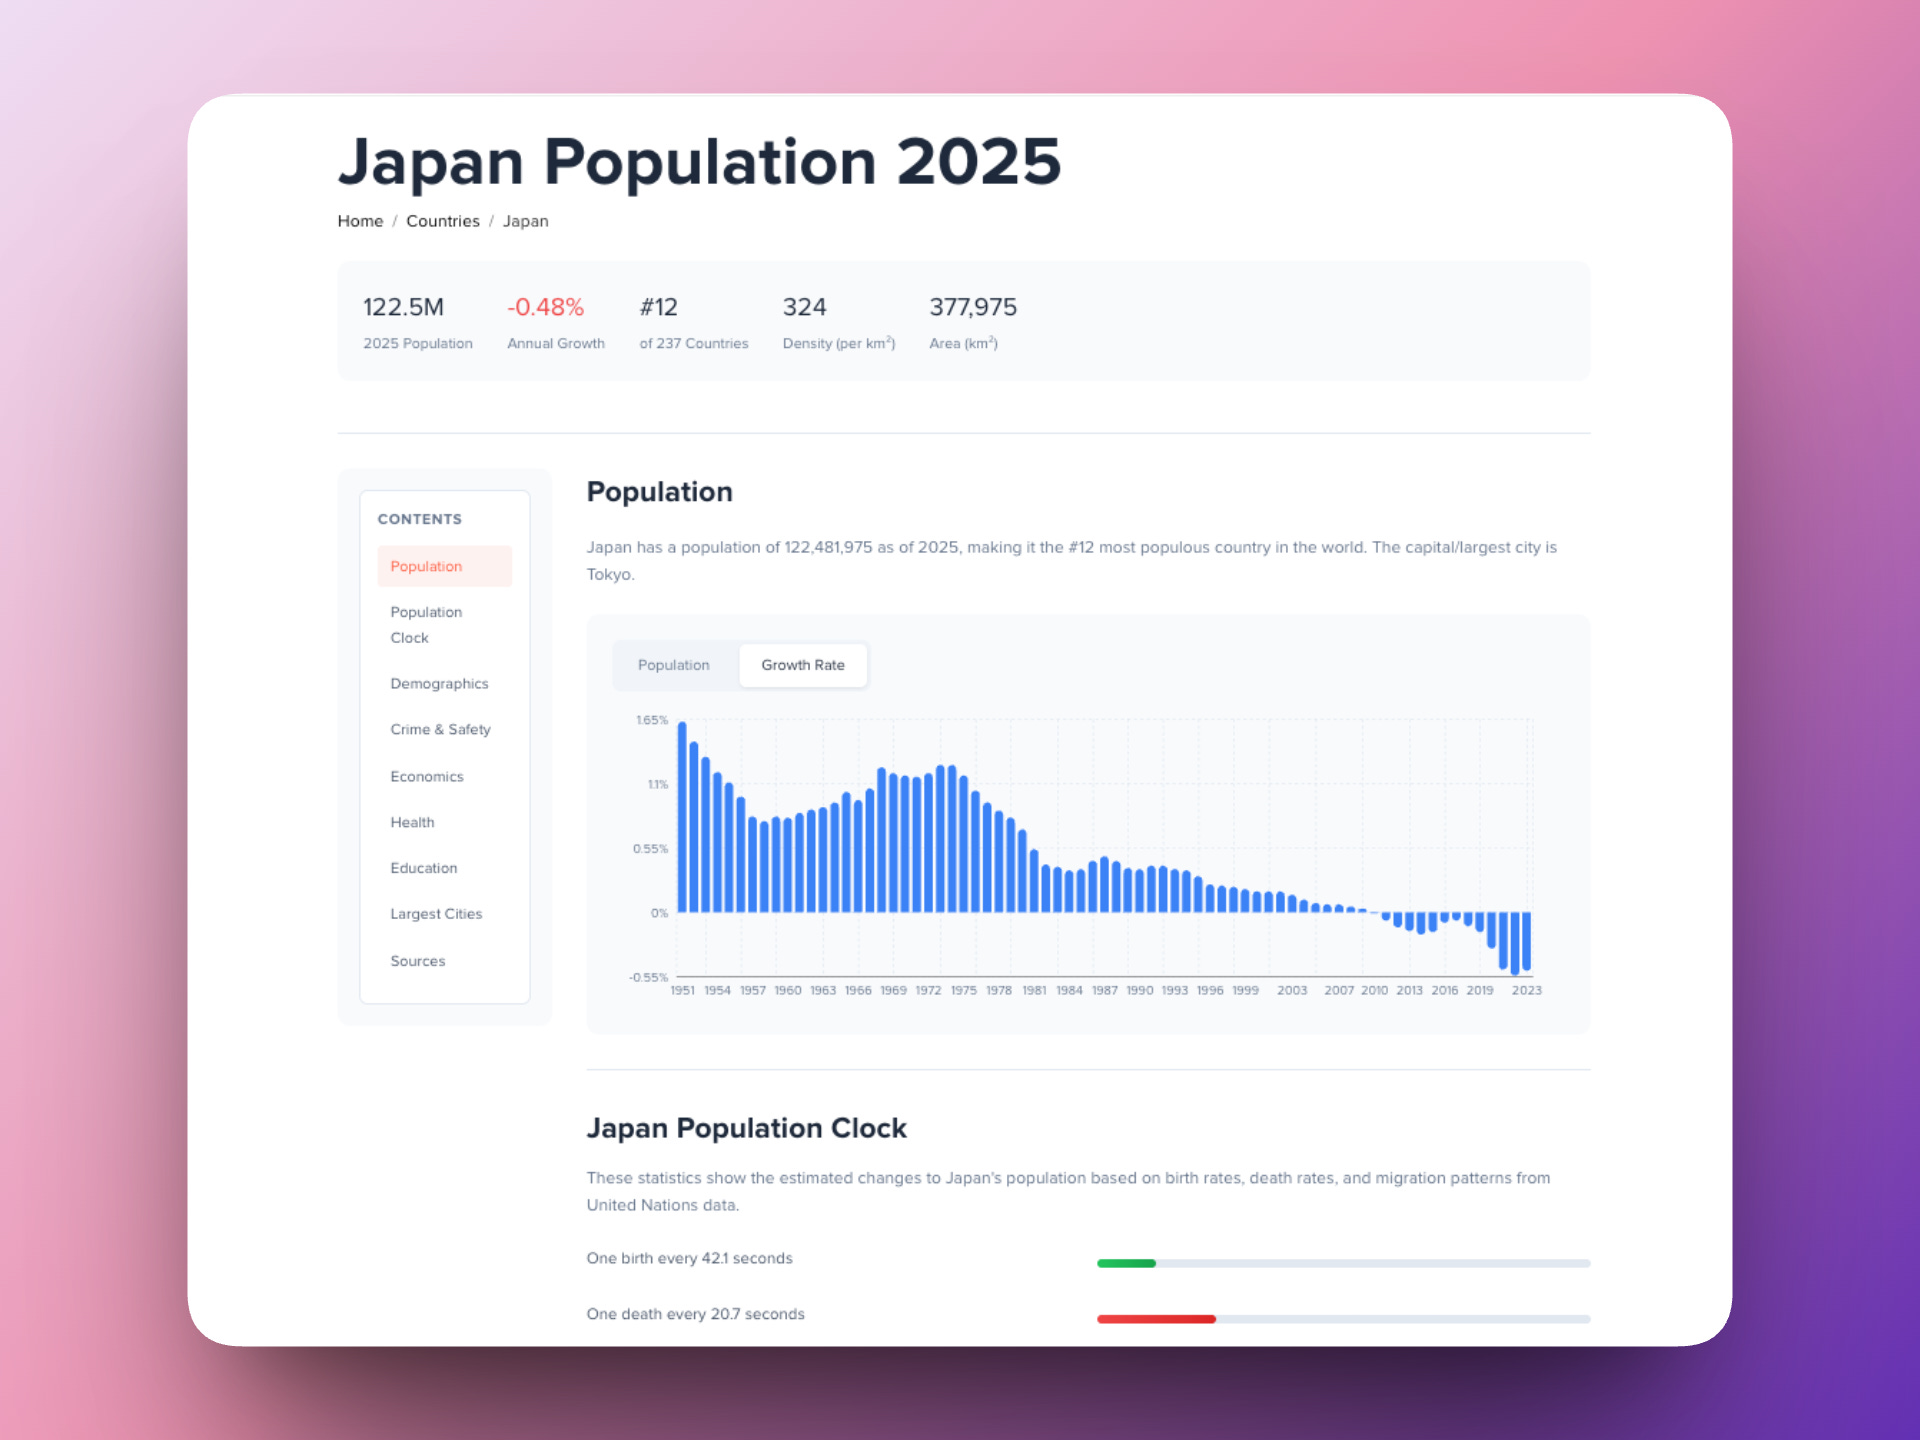
Country Profiles Built for Depth
Japan’s population is shrinking. You can see exactly how fast — and why — through the population clock (most accurate animated clock out there), growth rate charts going back to 1951, and a full breakdown across demographics, crime, economics, health, and more.
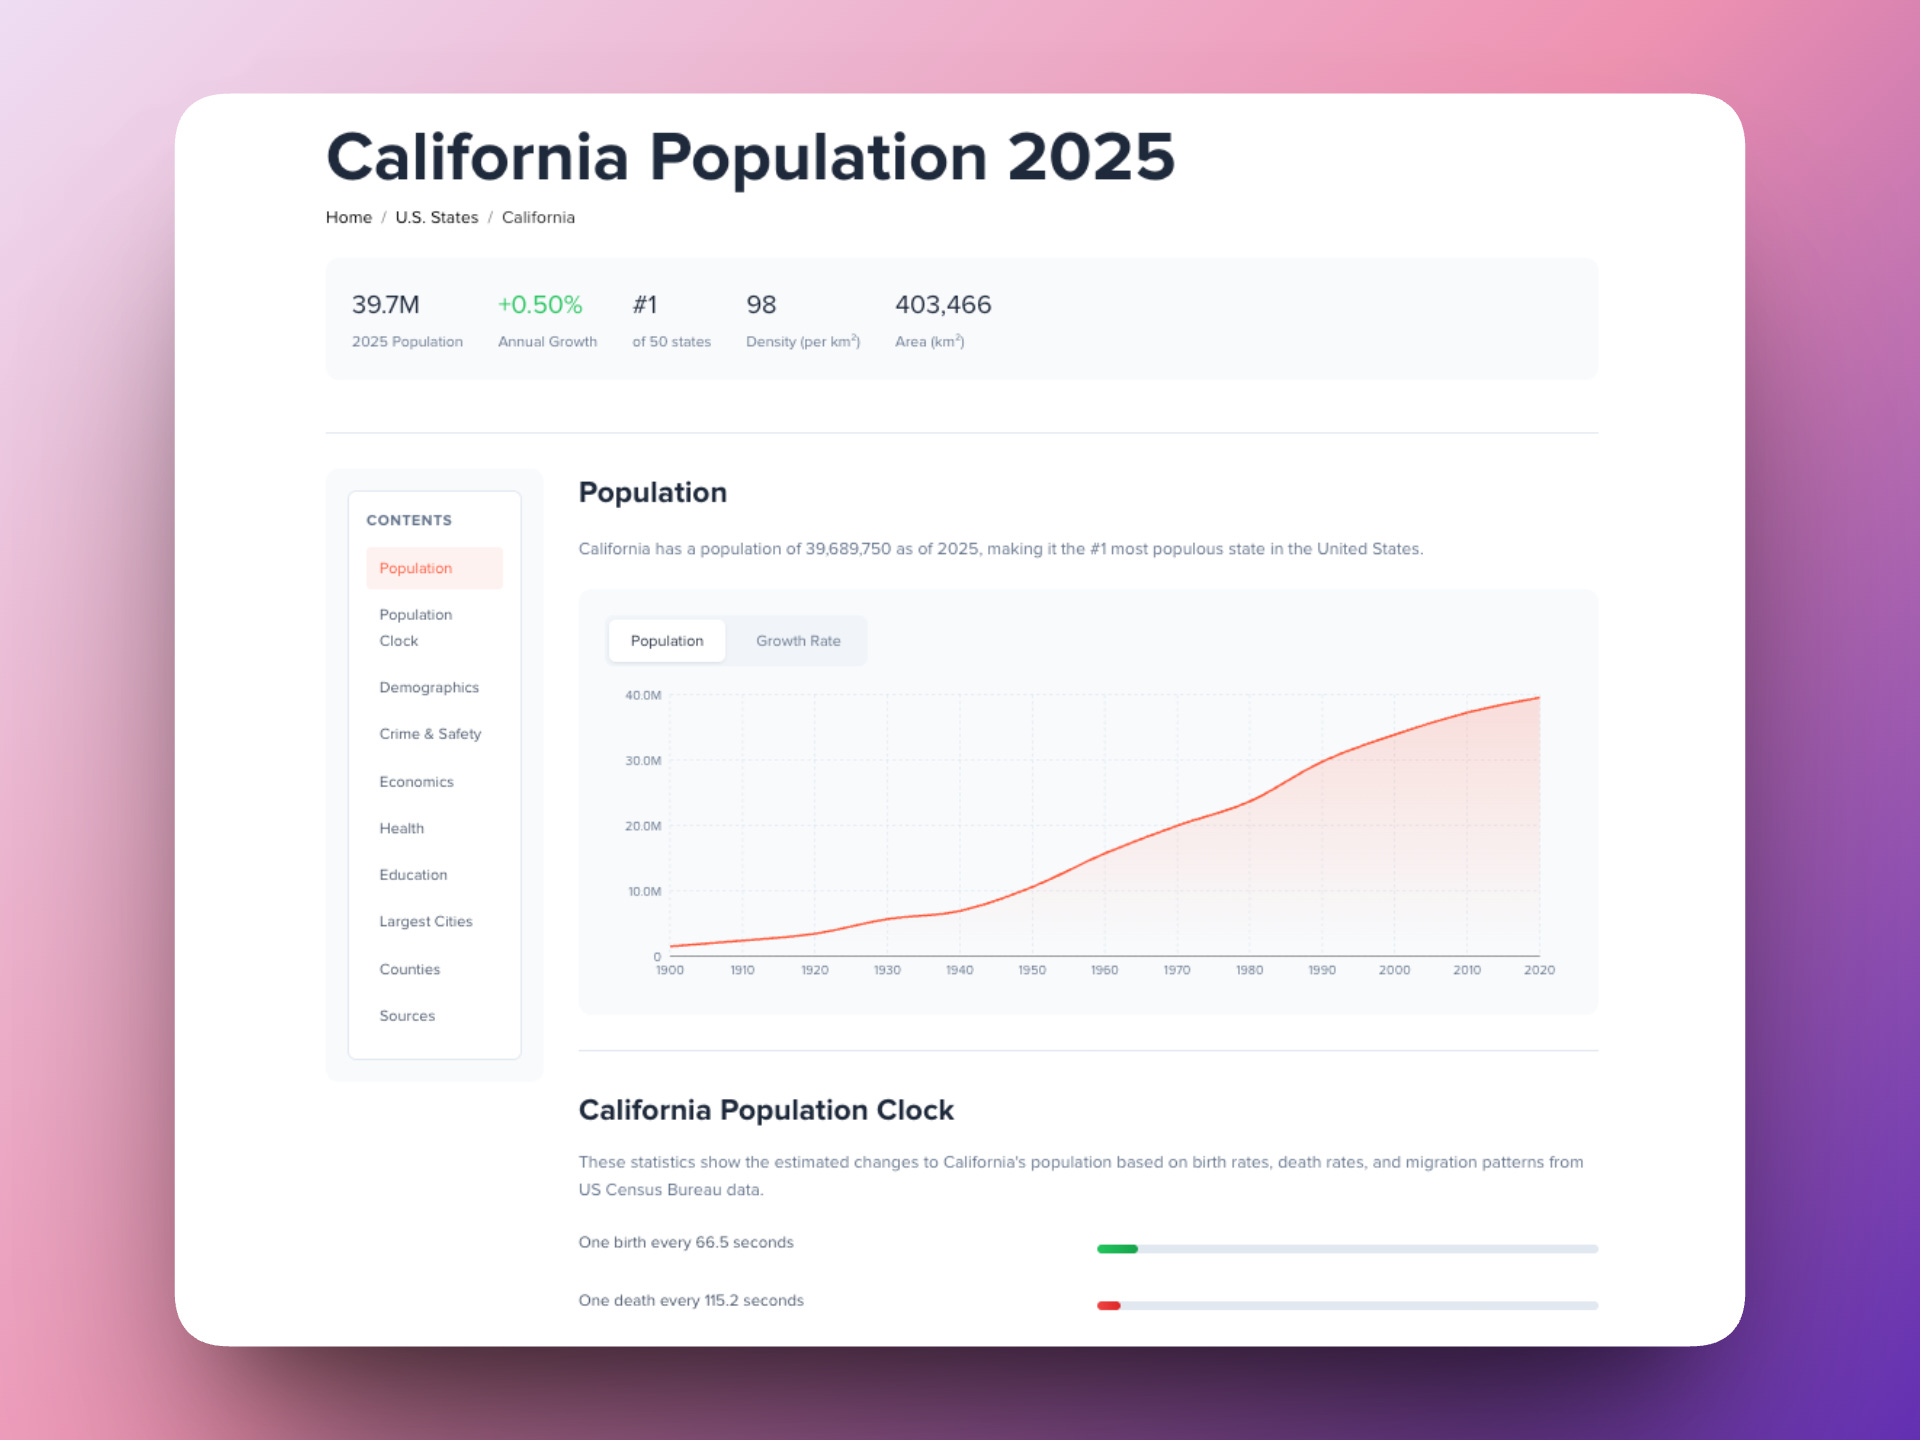
State Profiles That Go Beyond the Headline
California’s page doesn’t just tell you it has 39.7M people. It shows you the trajectory since 1900, the live population clock (one birth every 66.5 seconds), and links directly into counties — a layer we just expanded significantly.
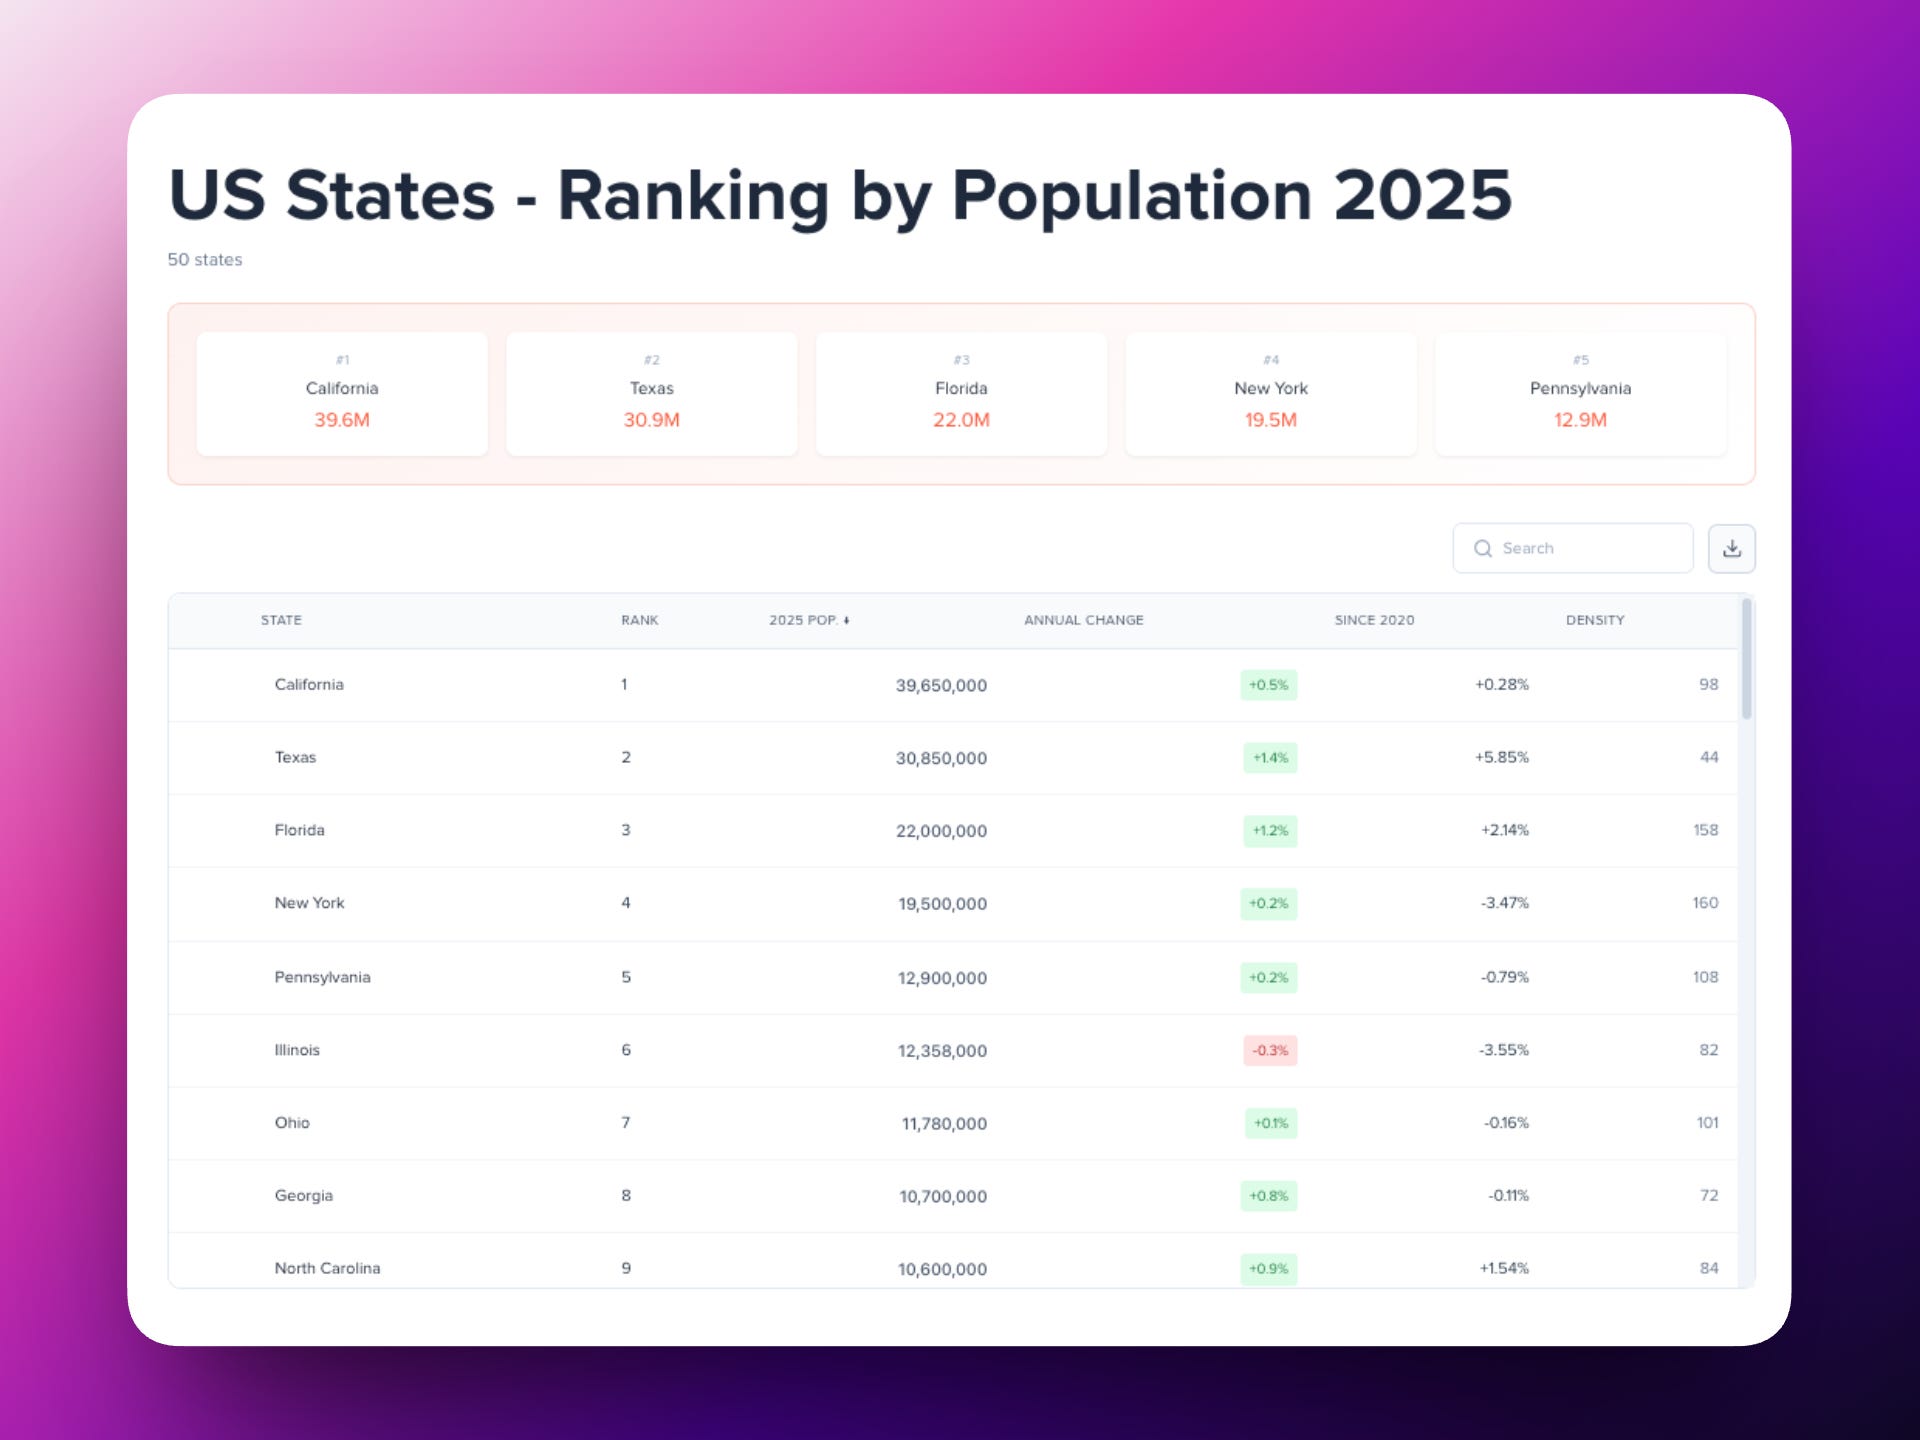
Rankings You Can Actually Use
Sort, search, and download. State rankings include annual change, growth since 2020, and density — all in one clean view.
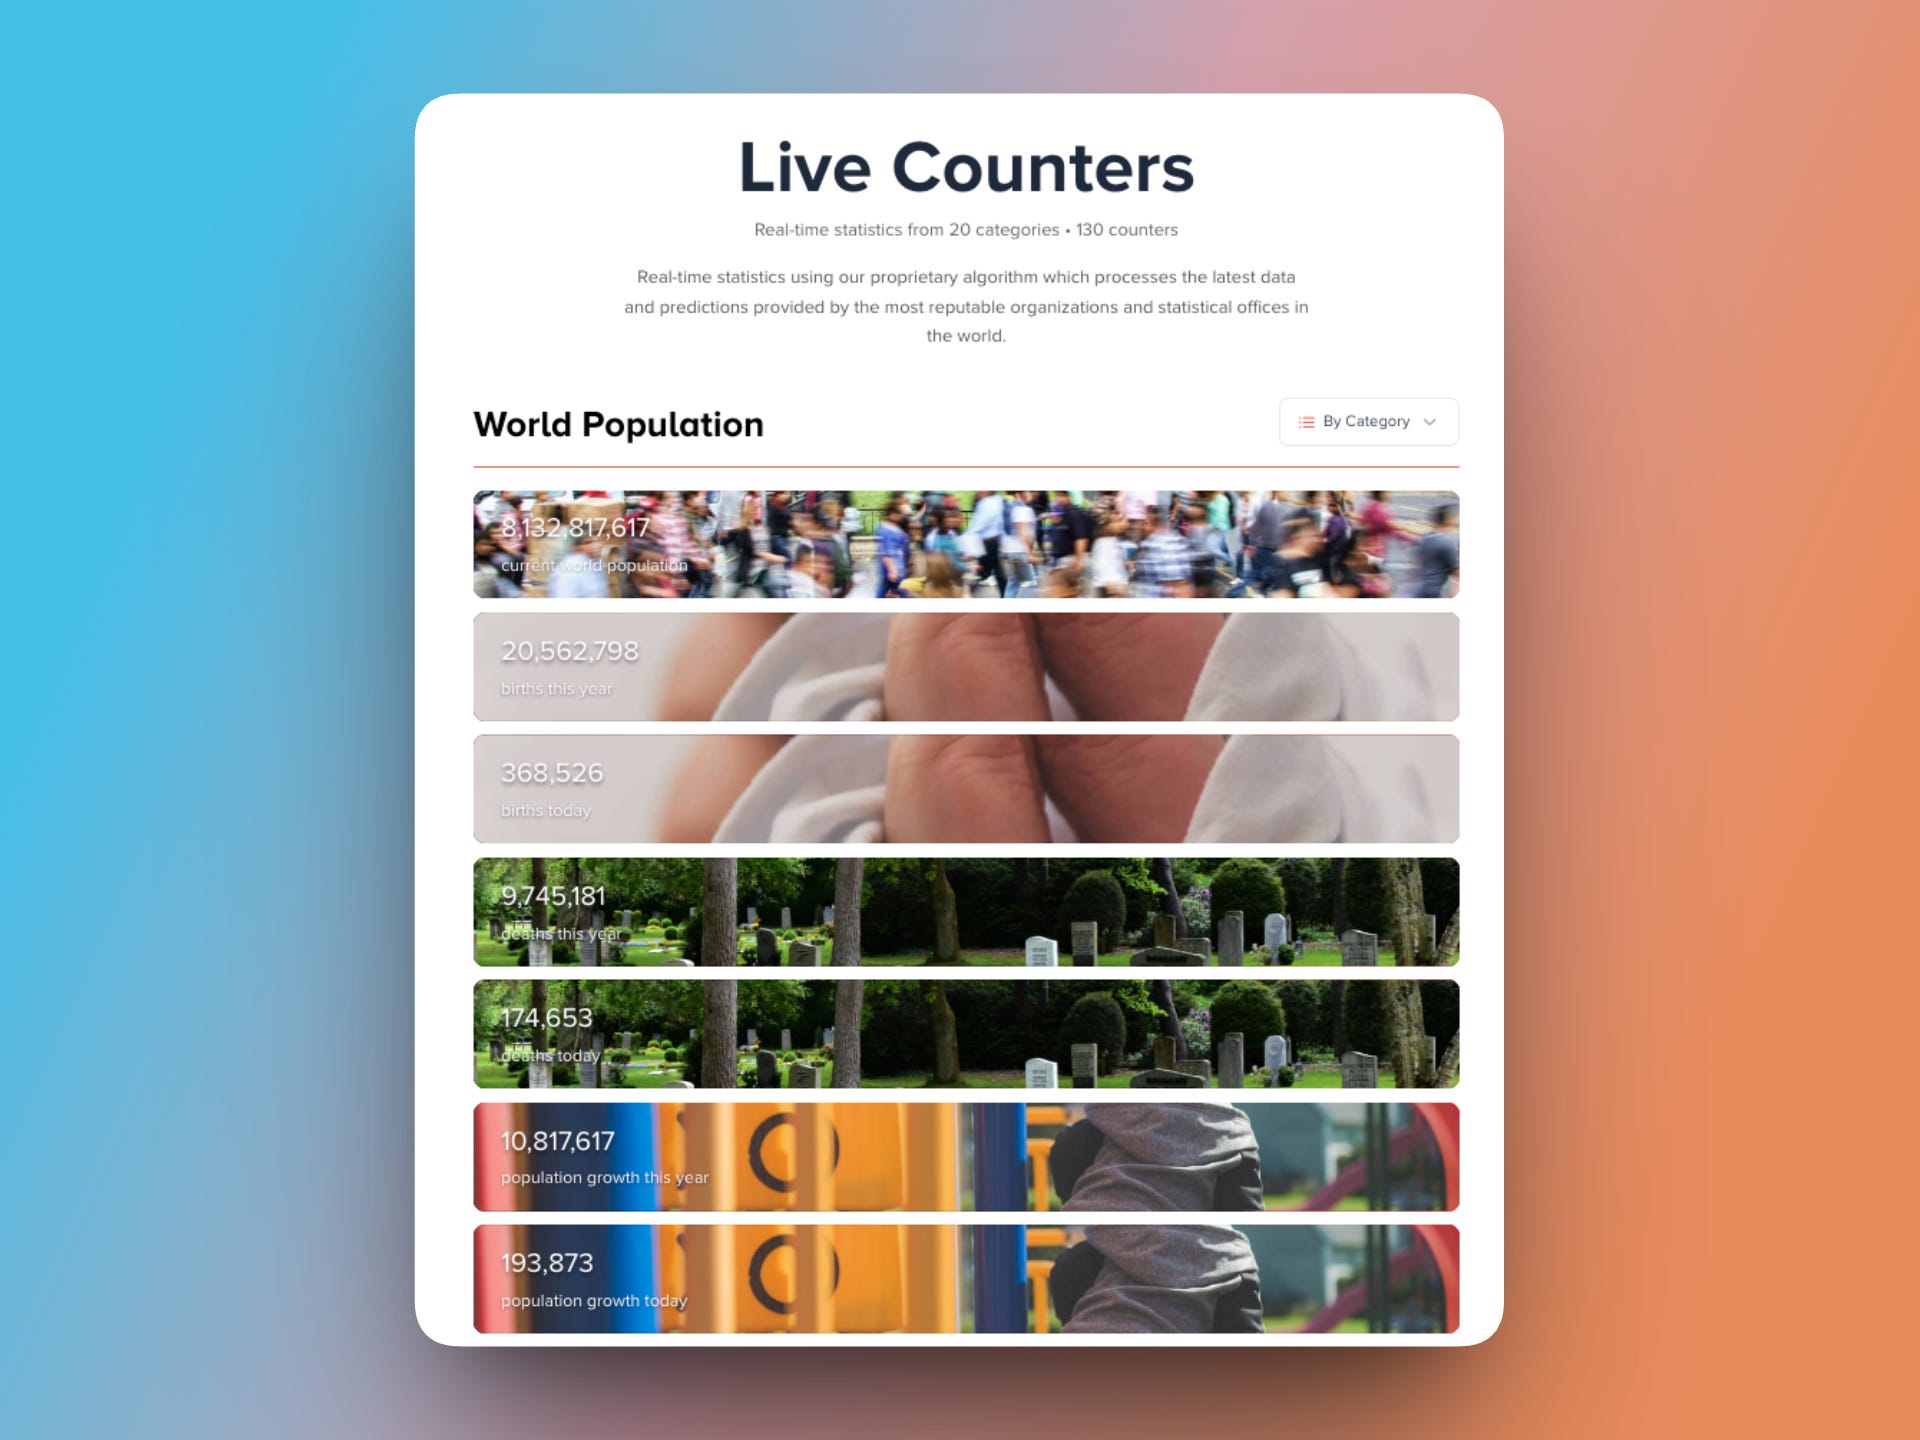
130 Live Counters Across 20 Categories
This is one of the features people come back to, our most popular section on the site by FAR. Real-time statistics — births, deaths, population growth, energy use — updating live, every second.
Our proprietary algorithm pulls from the most reputable global statistical sources.
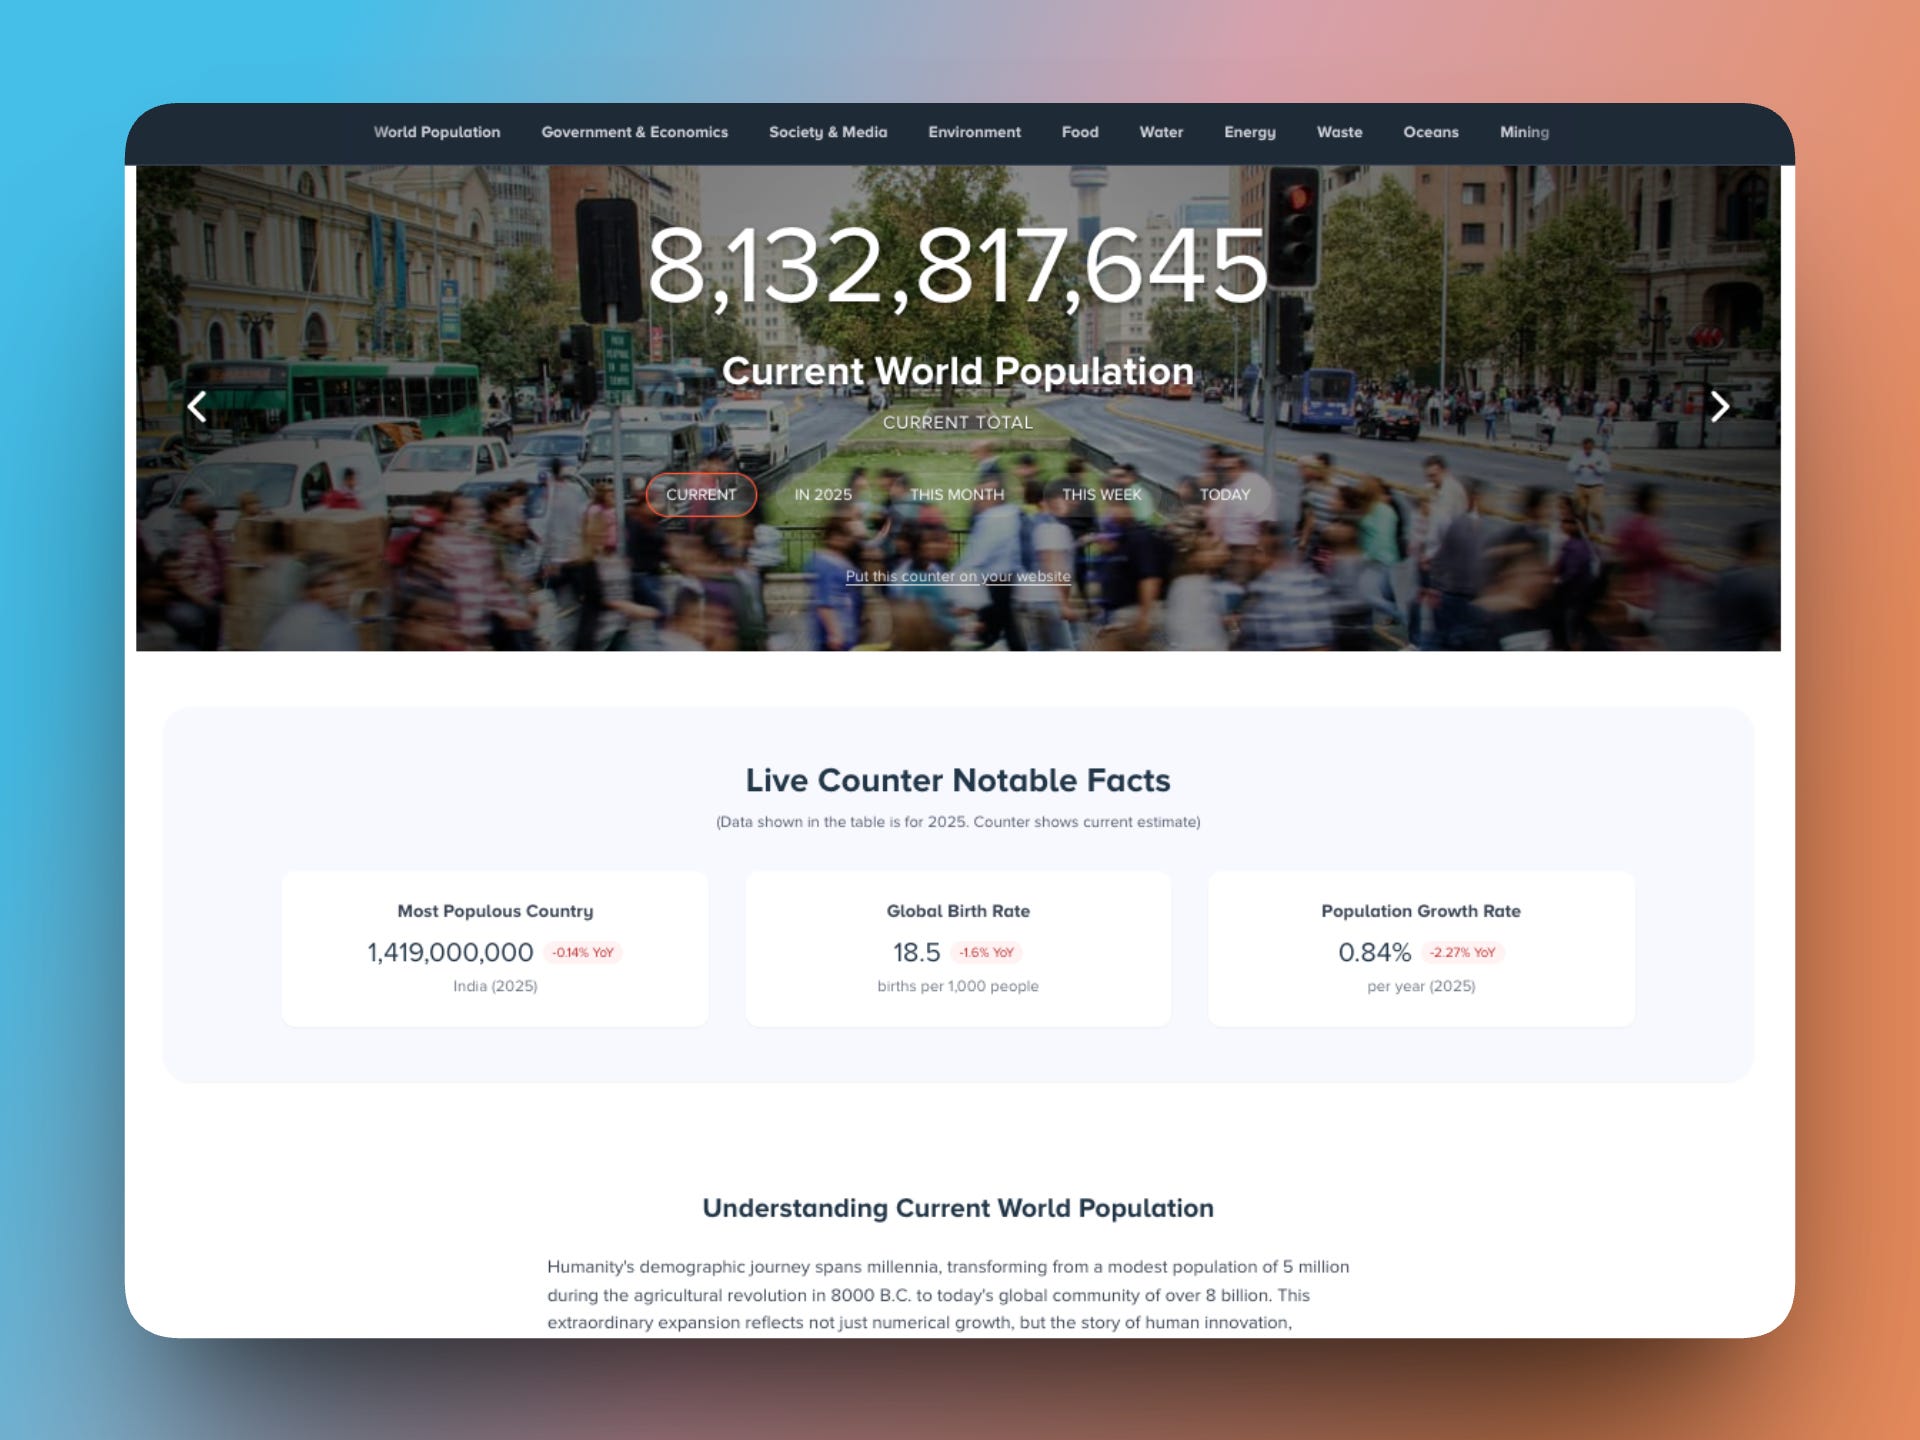
Built Differently Than What You’ve Seen Before
If you’ve used Worldometer (old news btw), you know the concept. StatsPanda takes it further — organized by category, paired with context, and built to actually teach you something while the numbers tick.
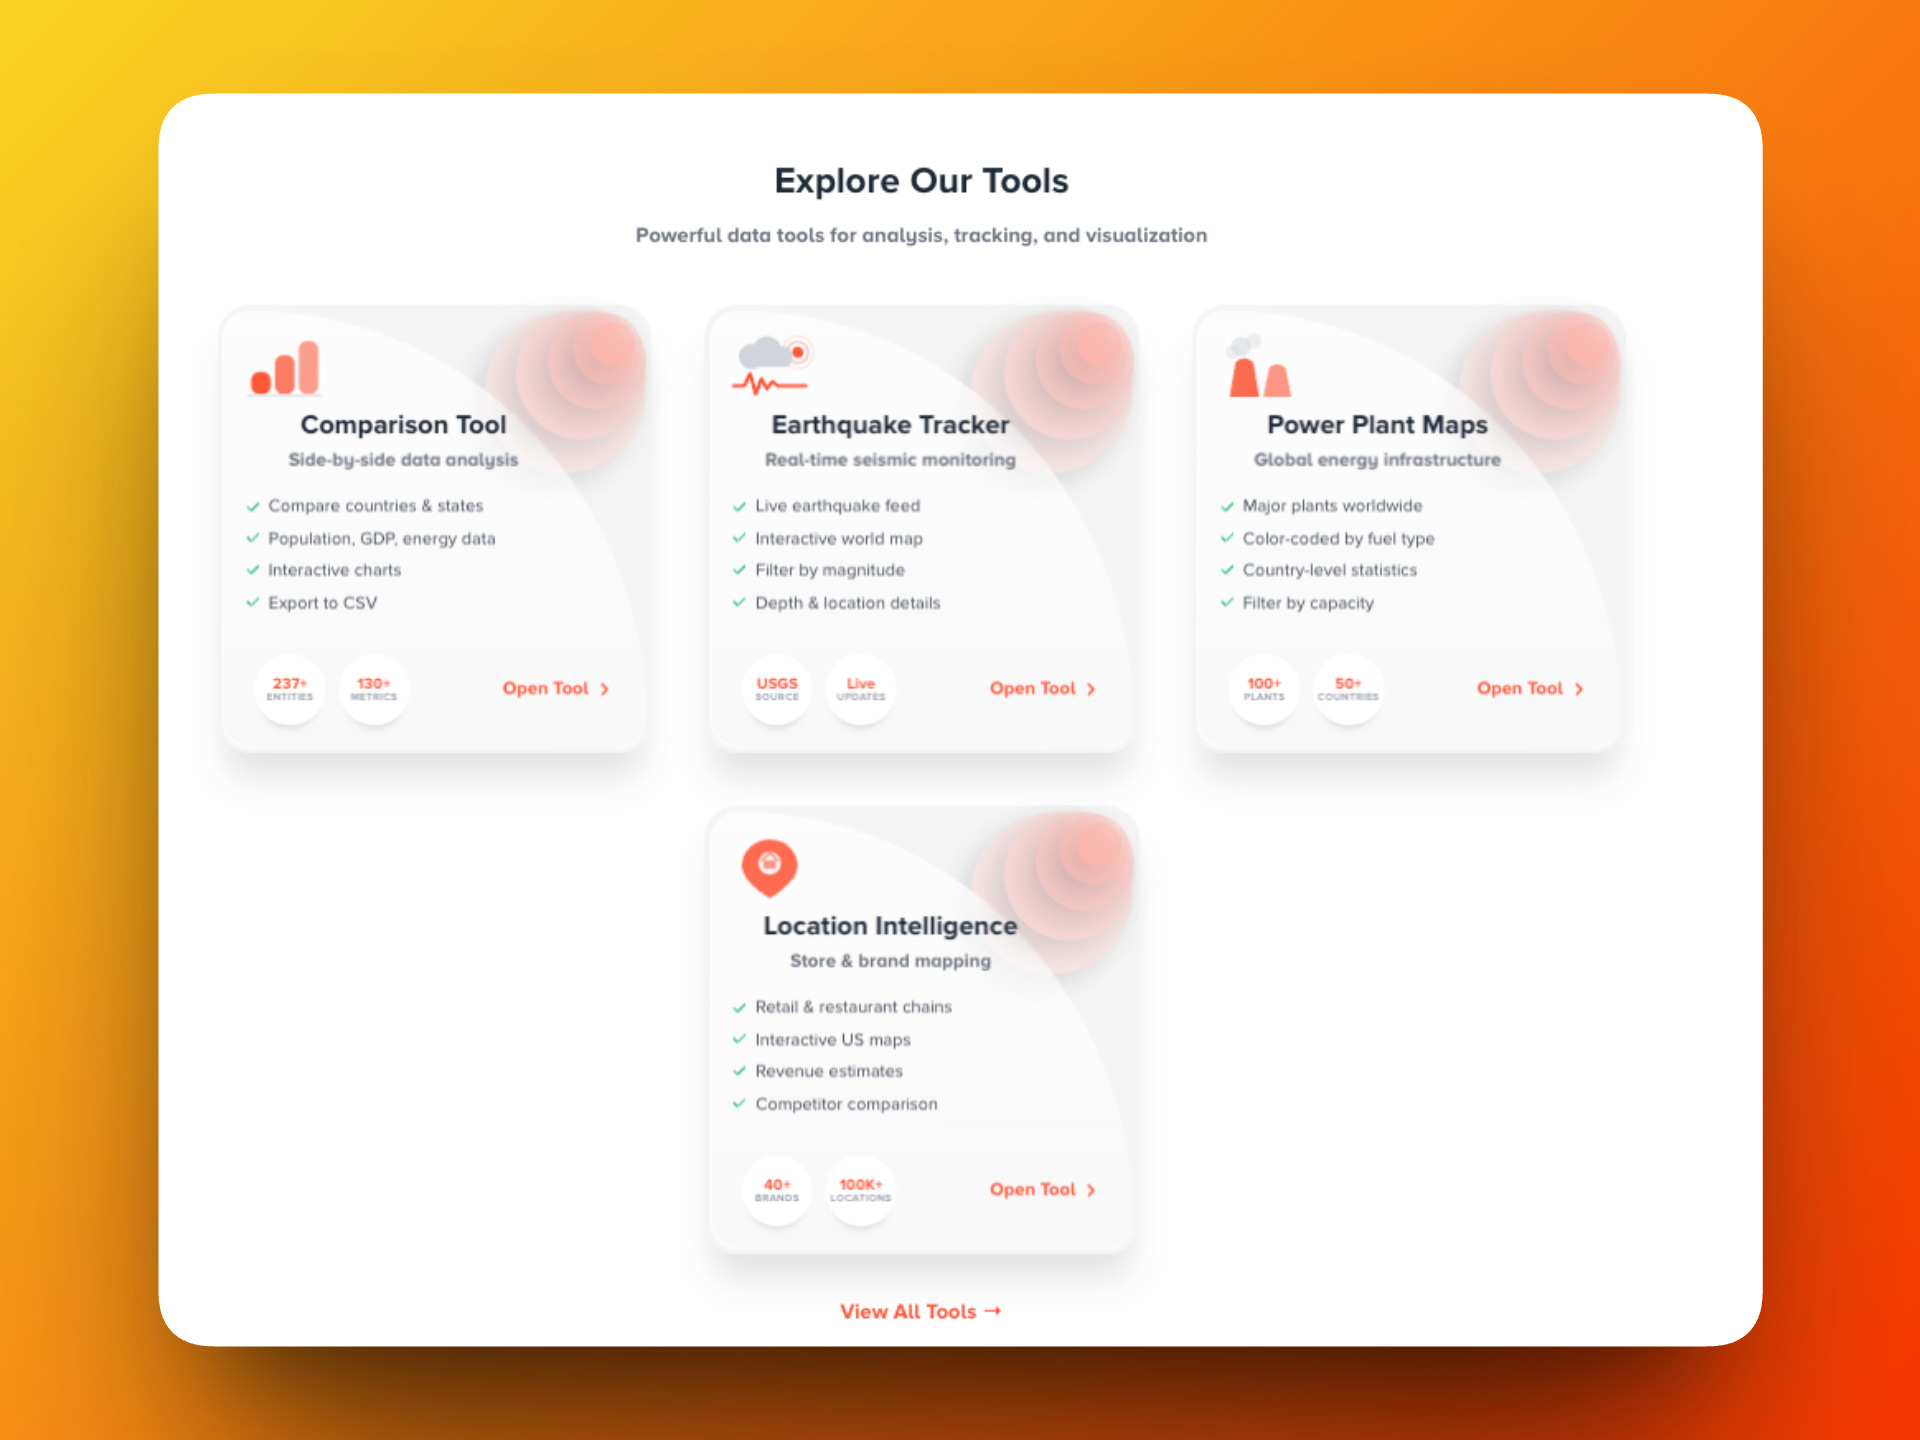
Tools Built for the Curious (and the Professional)
Beyond data pages, the platform now features dedicated tools: a Comparison Tool for side-by-side country and state analysis, an Earthquake Tracker with live USGS data, Power Plant Maps across 50+ countries, and the new Location Intelligence tool for mapping retail chains and brands across the US.
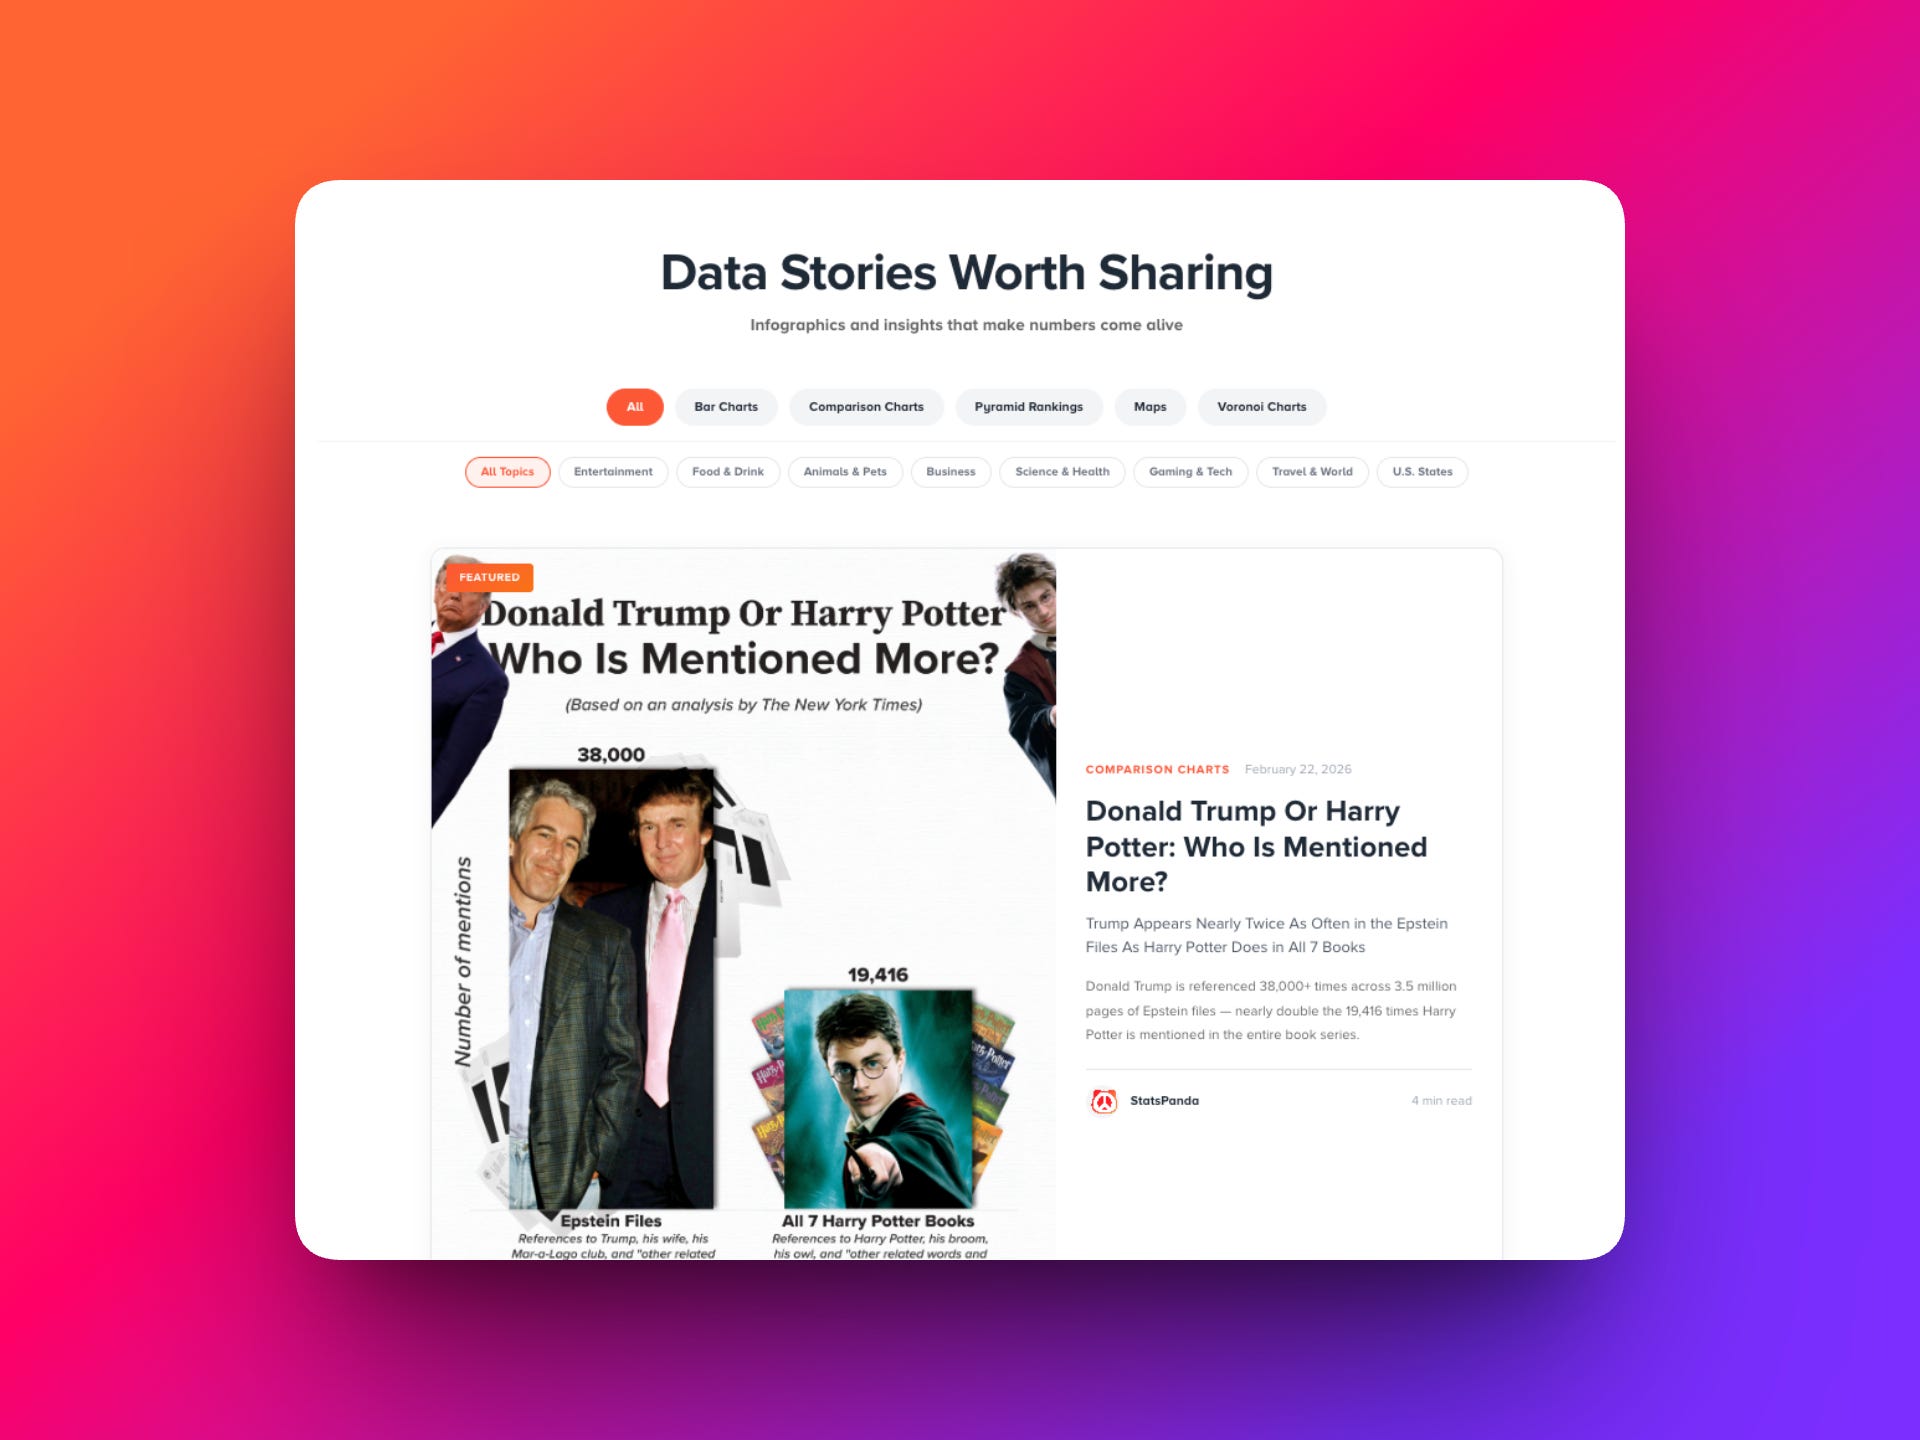
And Yes — The Stories Are Still Here
“Trump or Harry Potter: Who Is Mentioned More?” went live yesterday. The Data Stories section is now a full editorial channel on the site — filterable by chart type and topic. Subscribers get every new story in their inbox. The site gets a permanent home for them.
A Thank You — And an Offer Worth Considering
If you’ve been reading this newsletter since the beginning, firstly thank you, you’ve watched StatsPanda grow from a side project into something that’s starting to look like a real contender.
To thank you for being here early, our annual subscription is 50% off — $15/year instead of $30 — exclusively for newsletter subscribers.
Premium unlocks, advanced data exports, ad-free browsing, no limits on tool usage, export reports, csvs, and more with no usage tracking. And most importantly you’ll show support to a small business and small journal/media.
This offer expires March 6th.
→ Claim 50% Off Annual Premium (use code at checkout)
You’re receiving this because you signed up at StatsPanda.com. We’ll never spam you — just data, updates, and the occasional thing worth your time.